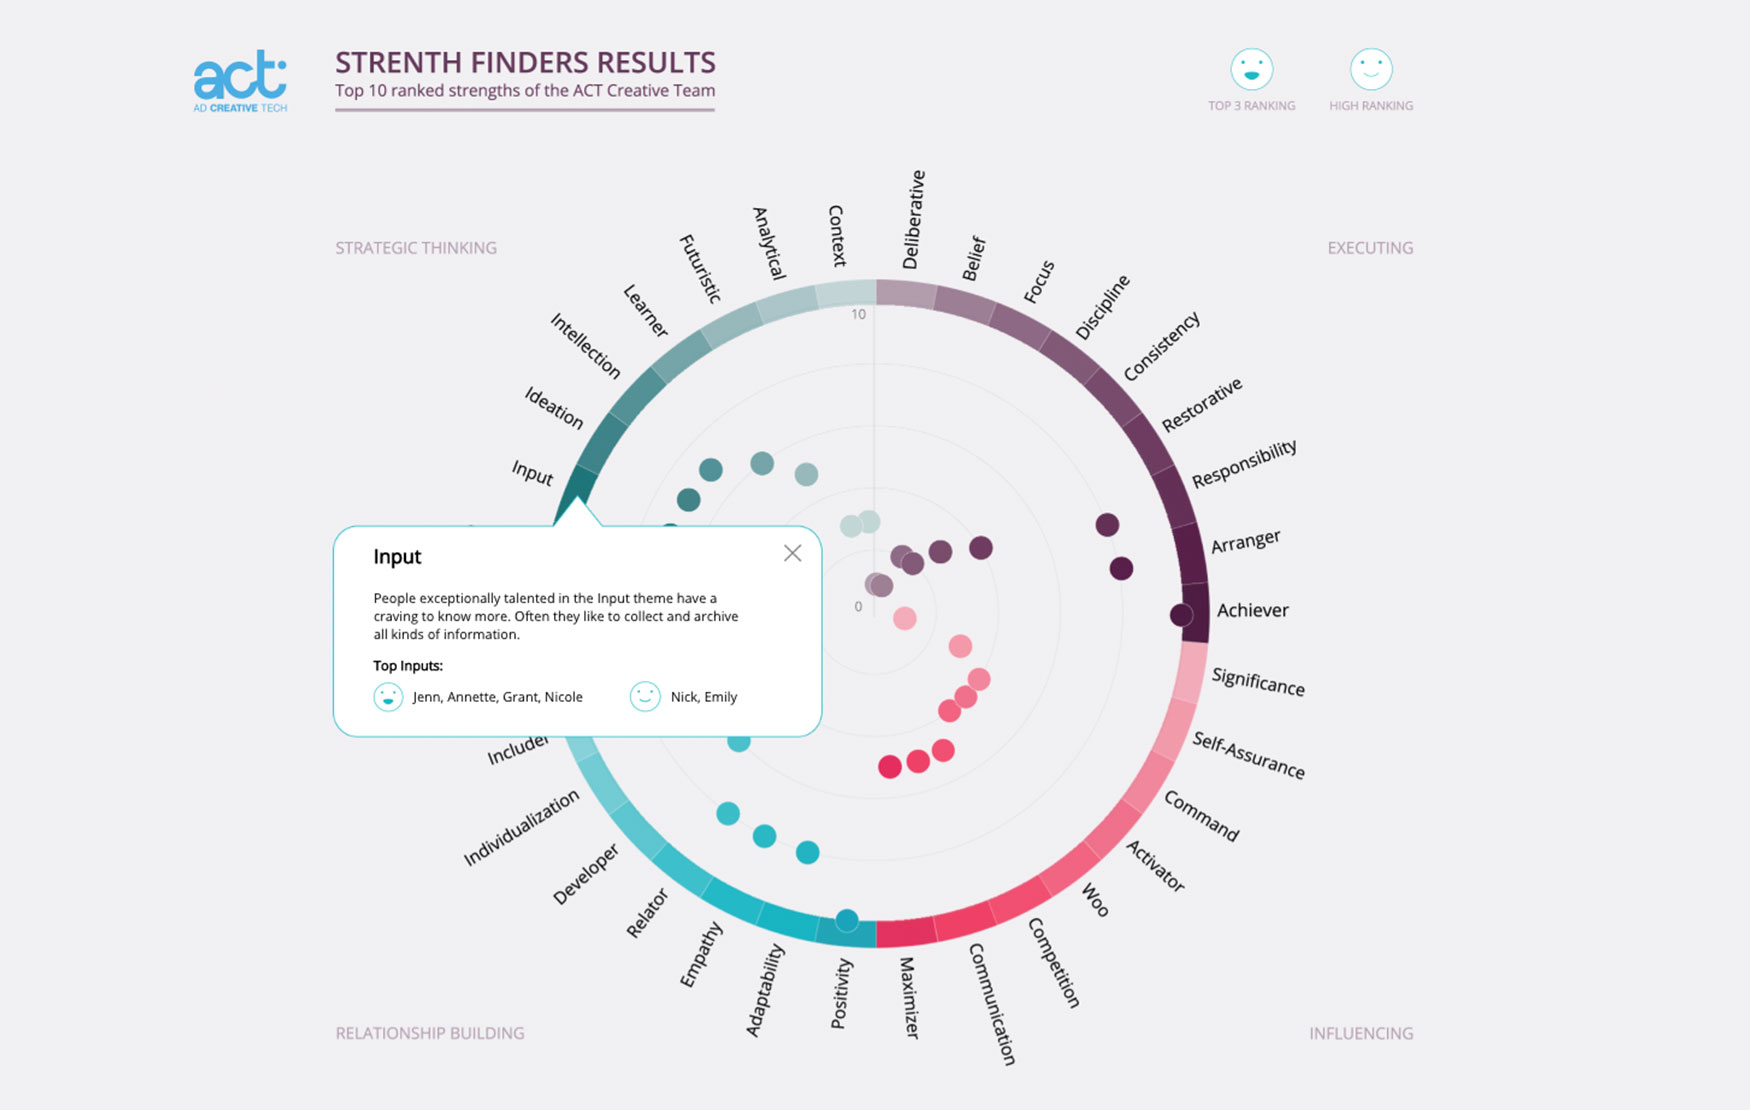

I designed and developed an infographic using the results from our design team’s personality training, StrengthsFinder. According to the philosophy of StrengthsFinder, there are four different areas where a person’s strengths lie: Strategic Thinking, Executing, Influencing, and Relationship Building.
By first looking at the data plot points, I decided that I wanted to have 2 different ways of displaying the data. First, a general way to look at our team as a whole, and second, from the scope of an individualistic level, including a simple spreadsheet layout. After sketching out some approaches and doing some quick math, I landed upon the final design of a circle split into 34 segments or about 10.5° to symbolize each strength. By clicking into the segment hotspots, you can find each definition as well as the top-ranked people for that category. I created this site from start to finish by stringing together 34 sequenced timelines and outputting the HTML and javascript files for the page.